Veröffentlicht May 28, 2023
Verfasser Solidigm
Artikel
QLC NVMe SSDs Are Optimal for Modern Workloads

Why are QLC NAND SSDs needed now?
More data is being created, stored, and analyzed than ever before. High-growth segments in computing today—such as artificial intelligence (AI) and machine learning (ML), big data/analytics, hyperconverged infrastructure (HCI), high- performance computing (HPC), content-delivery networks (CDNs) cloud digital video recorder (cDVR), and cloud storage—all require access to ever-expanding data volumes. And because these workloads need rapid, high bandwidth access to data, they require read-optimized performance with low latency.
While hard disk drives (HDDs) have historically been the standard for warm storage, they are struggling to keep up with the demands for these read-intensive workloads. Additionally, HDDs require a significant footprint in the data center, which adds to space, power, and cooling costs.
TLC NAND SSDs, on the other hand, are a good fit for mixed and write-heavy workloads, but they are typically not as cost-effective and capacity-optimized for large-scale, read-centric data needs. With 33 percent more bits per cell than TLC NAND SSDs, and efficient form factors providing up to 30.72TB of storage,
Solidigm QLC NAND SSDs enable both accelerated data access and high capacities (see Table 1).
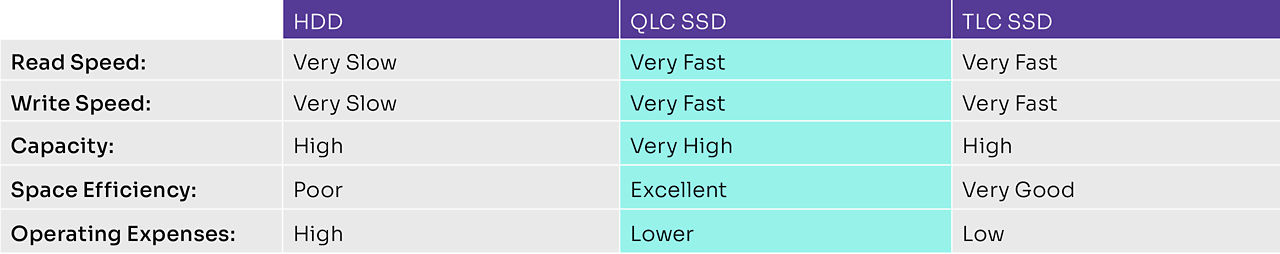
Table 1. QLC NAND SSDs: The sweet spot for read-intensive workloads.
Solidigm QLC 3D NAND SSDs: Unlocking the value of stored data
Like TLC NAND SSDs, QLC NAND SSDs can saturate the PCIe 4.0 bus on the read side and have near-TLC-like latency and quality of service (QoS). This makes the drive orders of magnitude more responsive than HDDs (see Table 2).
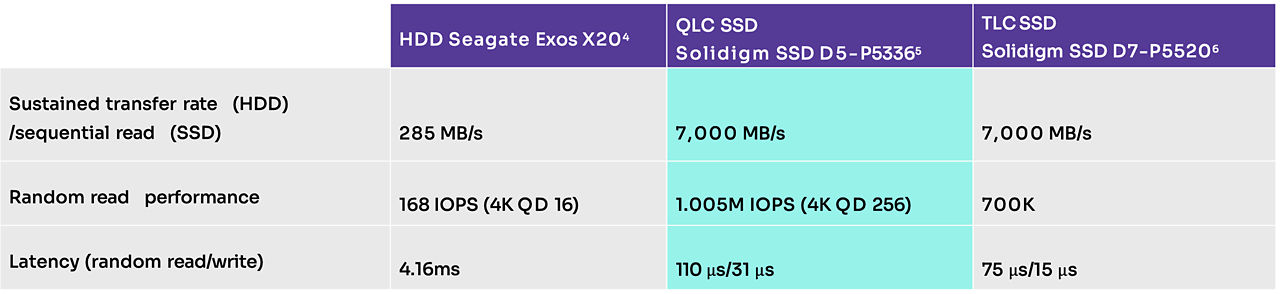
Table 2. How QLC SSDs compare to HDDs and TLC SSDs.
Modern workloads: characteristics and storage needs
QLC NAND SSDs are optimized for read-intensive workloads needing rapid access to vast datasets. Figure 1 shows examples of a range of workloads [8] that QLC NAND is well suited for based on I/O patterns.
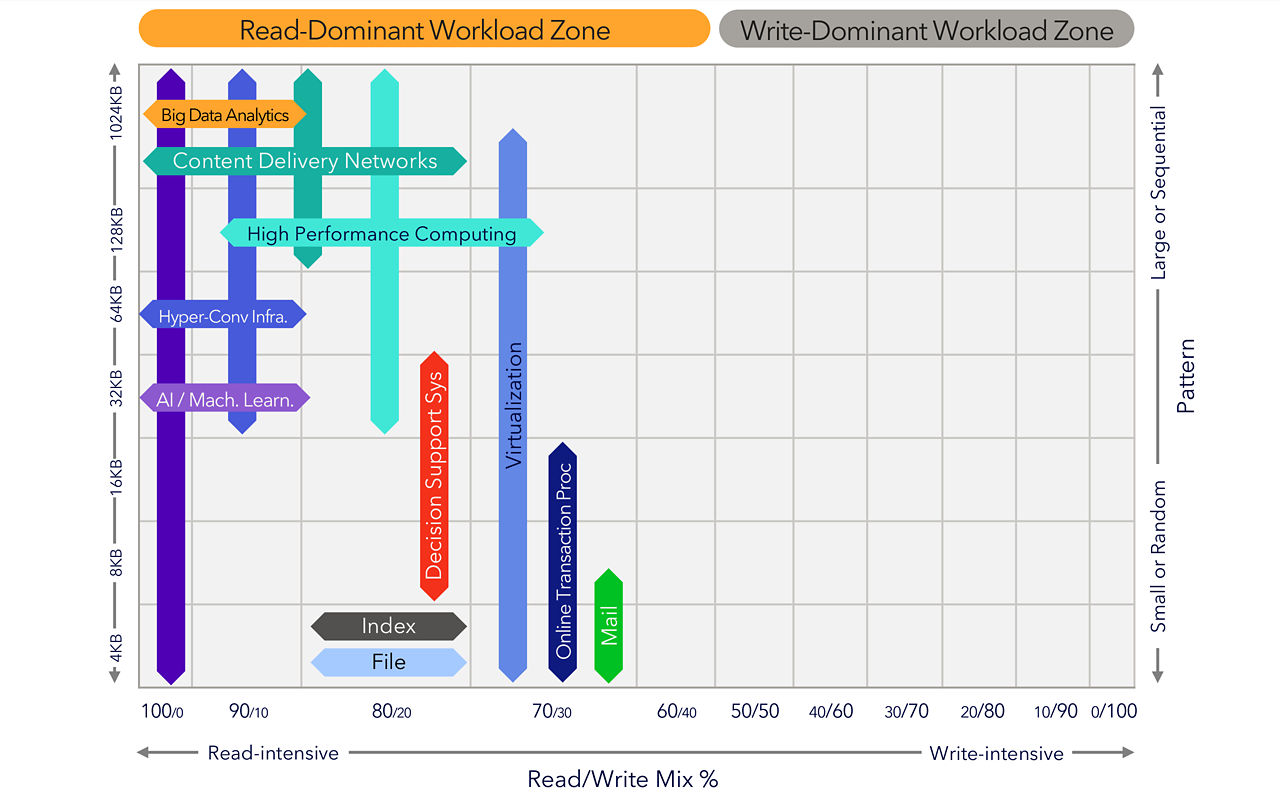
Figure 1. QLC NAND SSDs are optimized for read-intensive workloads.
The unique characteristics of these workloads are detailed in Table 3.
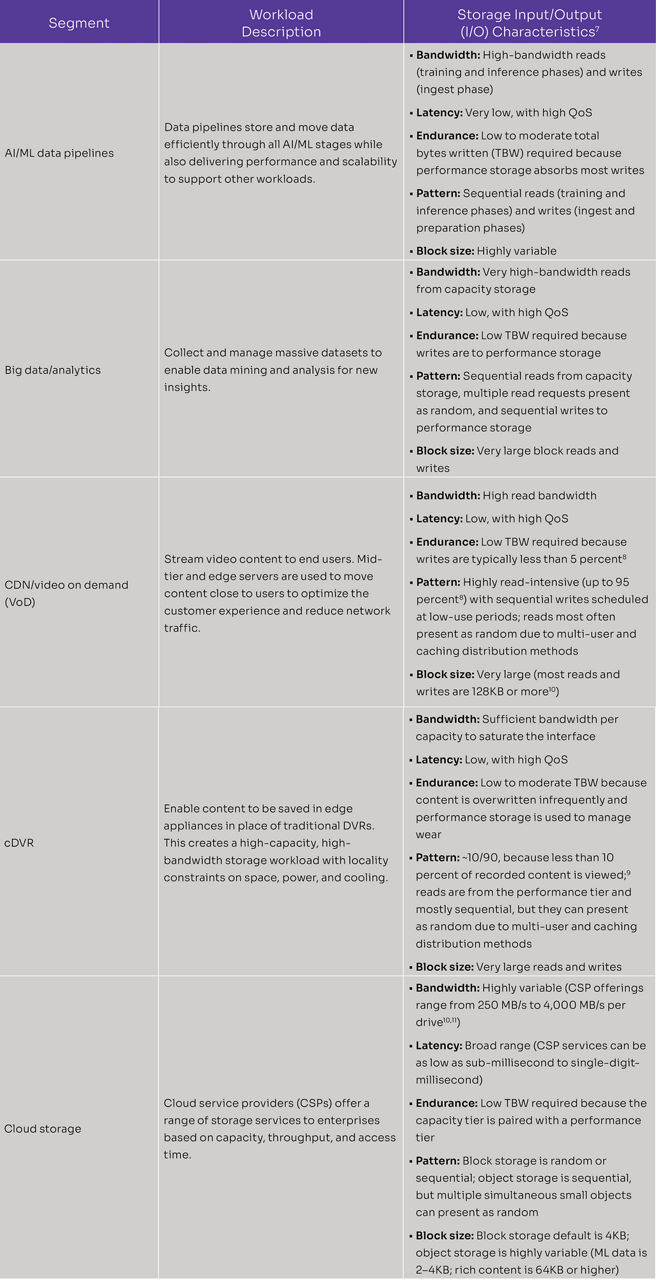
Table 3. Best-fit QLC SSD segments and workloads.
Extract more value from your data with Solidigm QLC 3D NAND SSDs
Built on proven technology, Solidigm QLC 3D NAND SSDs provide exceptional high-bandwidth, low-latency read performance to support modern business-critical workloads, including ML, AI, CDNs, analytics, and big data while helping to lower TCO compared to HDDs and TLC SSDs by consolidating the storage footprint and reducing operational costs.
Notes
[1] “Up to 20x reduction of warm storage footprint” claim is based on comparing 4TB HDDs, which require 10 (2U) of rack space to fill up 1PB or storage, against 30.72TB Solidigm SSD D5-5316 E1.L or U.2 drives, which take 1U of rack space to fill up 1PB of storage.
[2] Using a CDN mid-tier server opportunity. Baseline server assumptions of 20K active users, minimum capacity of 480TB, target throughput of 190Gbps, and 85 percent cache hit ratio. Hybrid array per server configuration of 2 x Intel® Xeon® Scalable 6330 processor, 512GB memory, 12 x 8TB Seagate Exos HDD with 2.088Gbps throughput, 2 x 7.68TB Solidigm SSD D7-P5510 with 56Gbps throughput. Hybrid array cost (CPU + memory + RAID controller + NVMe expander + chassis + power supply) net of storage $10,530. All-QLC per server configuration of 2 x Intel Xeon Scalable 6338N processor, 512GB memory, 20 x 30.72TB Solidigm SSD D5-P5316 with 54.4Gbps throughput. All-QLC server cost (CPU + memory + RAID controller + NVMe expander + chassis + power sup- ply) net of storage $11,530. HDD pricing as of March 15, 2021. SSD pricing is Solidigm budgetary pricing. Actual price can vary and may not reflect the pricing used in the TCO model. Operating cost assumptions of 1,100watts/server $0.12/kWh power and cooling and, $75.76 annual rack cost per RU.
[3] Sequential read performance based on Solidigm SSD D5-P5316 (https://www.solidigm.com/products/data-center/d5/p5316.html compared to Seagate Exos X18 (https://seagate.com/files/www-content/datasheets/pdfs/exos-x18-channel-DS2045-1-2007GB-en_SG.pdf).
[4] Western Digital Data Sheet: Ultrastar DC HC650. https://documents.westerndigital.com/content/dam/doc-library/en_us/assets/public/western-digital/product/data-center-drives/ ultrastar-dc-hc600-series/data-sheet-ultrastar-dc-hc650.pdf.
[5] “Solidigm D5-5336 Series: https://www.solidigm.com/products/data-center/d5/p5336.html
[6] “Solidigm SSD D5-5316 provides industry-leading endurance at 0.41 DWPD.” https://www.solidigm.com/products/data-center/d5.html
[7] Solidigm SSD D7-P5510 Series. https://www.solidigm.com/products/data-center/d7.html
[8] HPC workload characterization assumes I/O optimization through persistent memory using DAOS (Distributed Asynchronous Object Storage).
[9] Storage workload characterizations are, unless noted otherwise, Solidigm estimates based on subject-matter expert deep knowledge of storage I/O patterns and behavior for a given segment.
[10] Percentage is an estimate based on Solidigm internal analysis across top tier CDNs.
[11] Percentage is an estimate based on Solidigm internal analysis across top tier cDVRs.
[12] Amazon AWS. “Amazon EBS Volume Types.” https://docs.amazonaws.cn/en_us/AWSEC2/latest/UserGuide/ebs-volume-types.html.
[13] Tencent. “An Overview of Cloud Hard Drive Prices.” https://cloud.tencent.com/document/product/362/2413.
[14] Percentage is an estimate based on Solidigm internal analysis across top tier HCI solutions.
[15] Microsoft. Azure/Virtual Machines/Disks. https://docs.microsoft.com/en-us/azure/virtual-machines/disks-types#premium-ssd.
[16] VMware. “Performance Metrics when using IOPS Limits with vSAN (vmware.com)” https://core.vmware.com/resource/vmware-vsan-design-guide#section1
Performance varies by use, configuration and other factors. Learn more at https://www.solidigm.com/products/data-center/d5.html
Performance results are based on testing as of dates shown in configurations and may not reflect all publicly available updates. See backup for configuration details. No product or component can be absolutely secure.
Your costs and results may vary.
Solidigm technologies may require enabled hardware, software or service activation.
Solidigm does not control or audit third-party data. You should consult other sources to evaluate accuracy.
© Solidigm 2023.